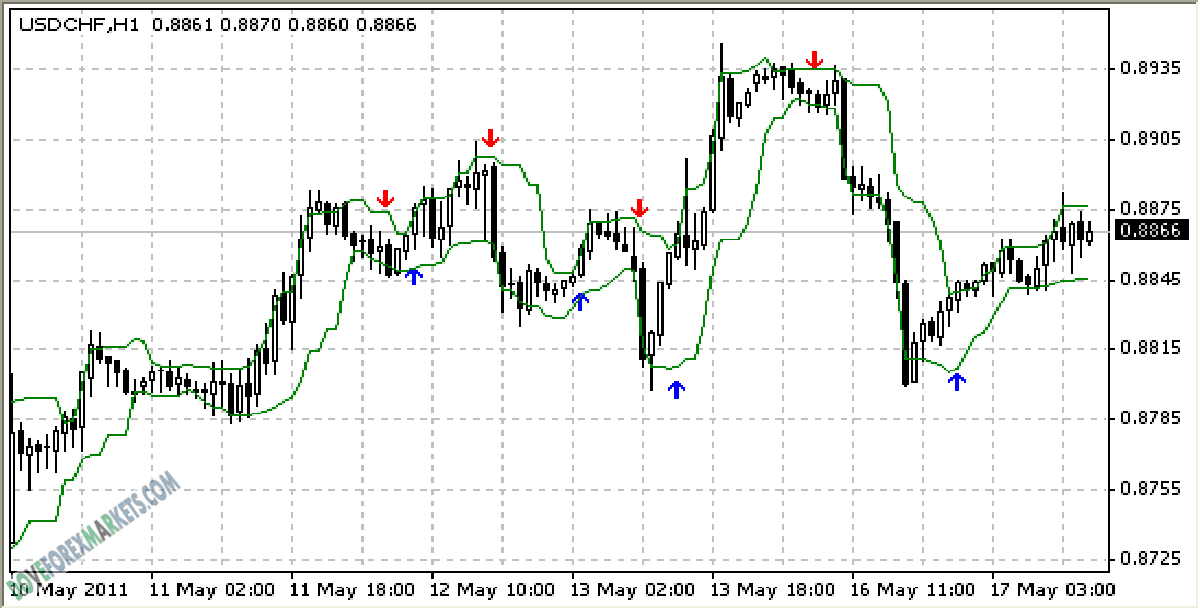
The Arrows Curves Indicator is a momentum indicator that finds breakout signals based on a price channel. The indicator plots two green lines on a chart, creating a channel-like structure that wraps around the price action. These lines serve as dynamic support and resistance levels.
In addition to the green lines, the indicator also includes arrows that indicate momentum breakouts. These arrows point in the direction of the breakout.
Blue arrows point upwards, indicating a bullish momentum breakout, while red arrows indicate a bearish momentum breakout.
How to use the Arrows Curves Indicator for MT4?
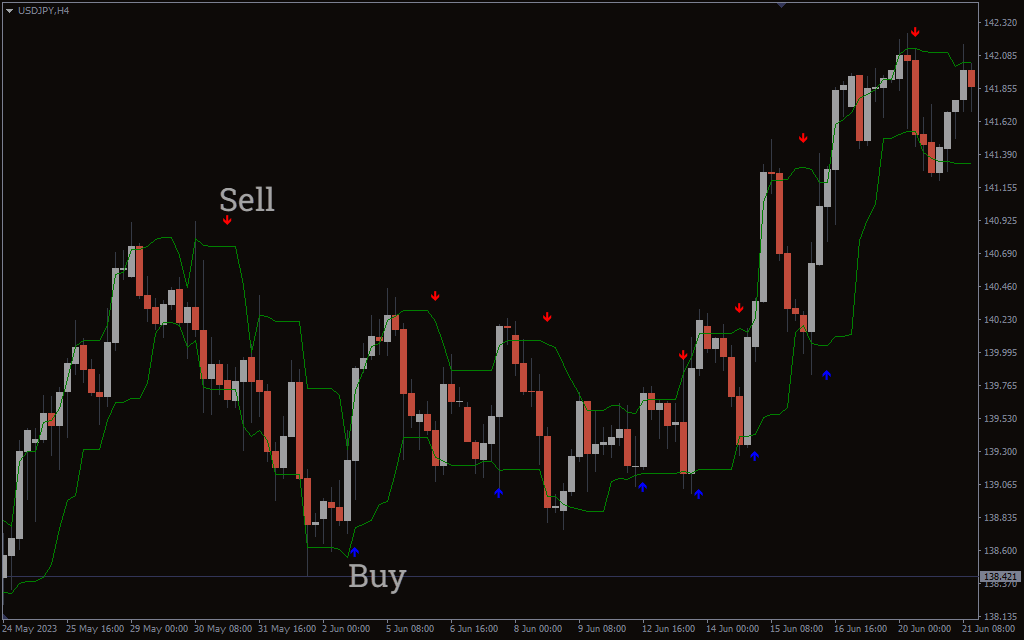
Arrows Curves Indicator BUY and SELL signals The above USD/JPY H4 chart shows the BUY/SELL signals of the indicator.
When a bullish momentum breakout occurs, the indicator plots a blue arrow pointing upwards. You can enter long positions or exit short ones.
On the other hand, when a bearish momentum breakout takes place, the indicator plots a red arrow pointing downwards. Here, you can go short or exit long positions.
While the Arrows Curves Indicator can provide valuable insights into momentum breakouts, it is recommended to use it in conjunction with other indicators.
Conclusion
The Arrows Curves Indicator for MT4 is a momentum indicator that identifies momentum breakout signals based on price channels. By looking at the interactions between the price action and the channel, as well as the appearance of the arrows, you can find the direction of the trend.
The author doveforexmarkets has offered the item for free, you can now download it.
Published:
24 Dec, 2024 05:51 PM
Version:
v1.0
Category:
Instructions Included:
YesSource Code Included:
NoFiles Included:
YesTags: