Become a Dove Forex Markets affiliate and start earning lucrative commissions today! Get It Now >

Fractal Support and Resistance Indicator

Fractal Support and Resistance Indicator
Free

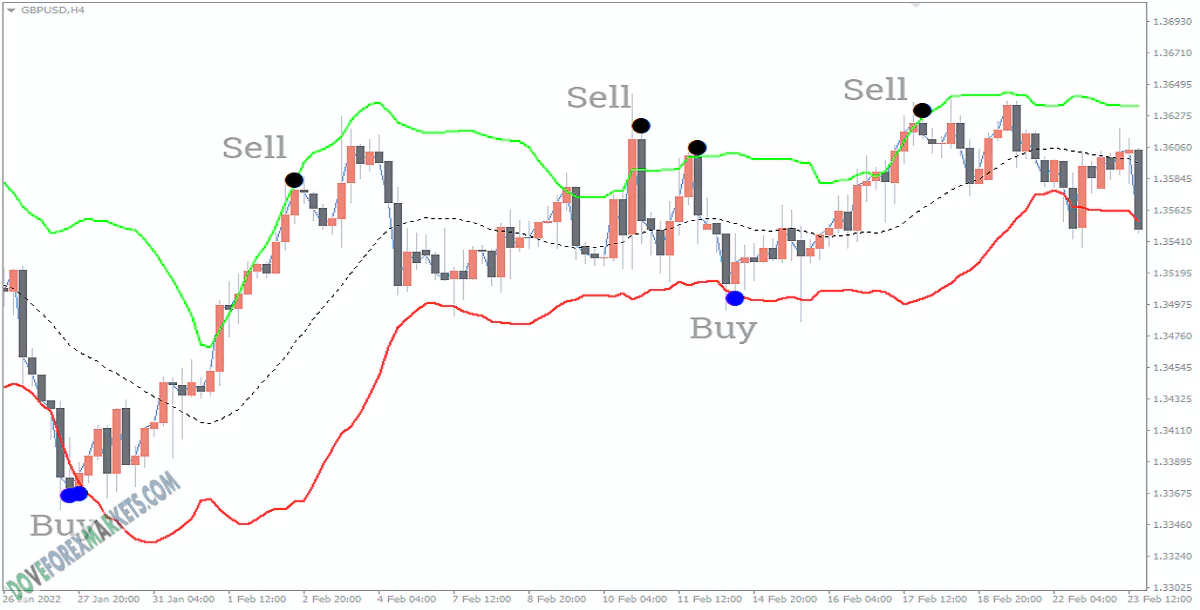
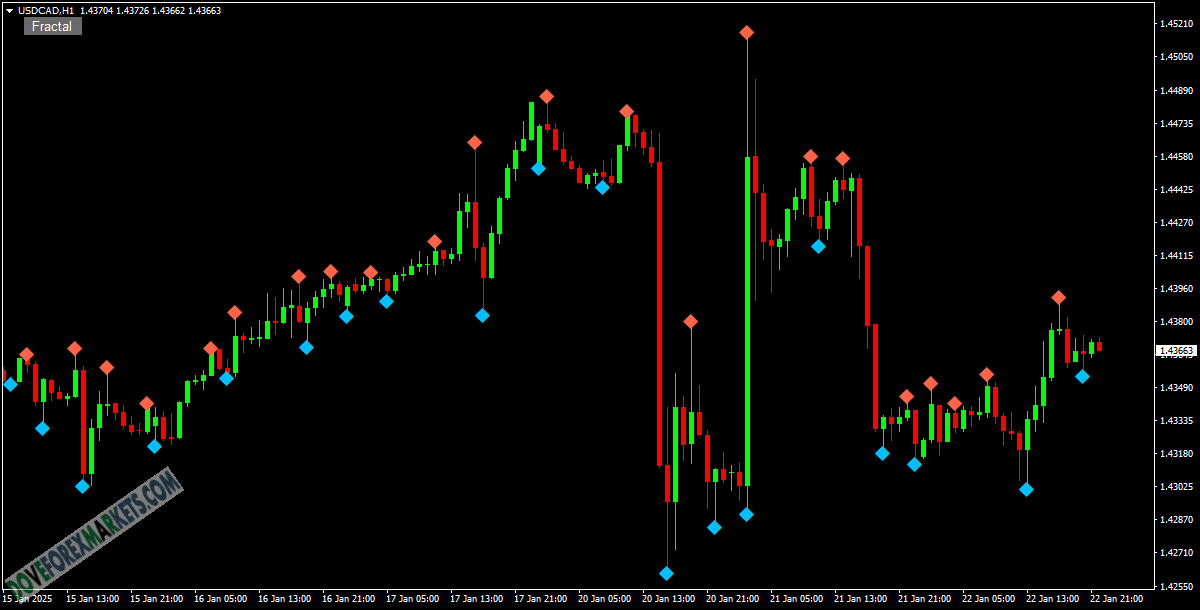
Introducing the Fractal Support and Resistance Indicator

Identify High-Probability Entry and Exit Points

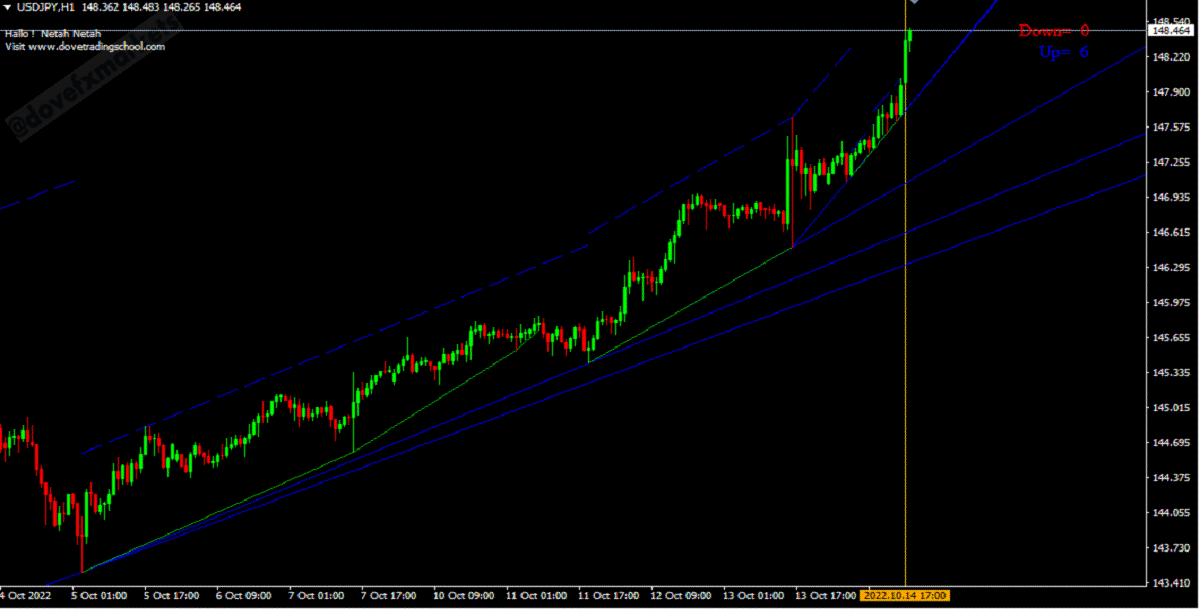
The Fractal Support and Resistance Indicator is a valuable tool for traders seeking to capitalize on potential price reversals at key support and resistance levels.

  • Fractals: The indicator utilizes the concept of fractals, which are price extremes that meet specific criteria and often mark potential turning points in the market.
  • Dynamic Levels: The indicator automatically identifies and plots both resistance (upper fractals) and support (lower fractals) levels on your chart, providing a clear visual representation of potential breakout and breakdown zones.
  • Early Entry Signals: By pinpointing these key levels, the indicator allows you to anticipate potential price reversals and position yourself for entry before the breakout or breakdown occurs.

Key Features:

  • Automated Fractal Detection: The indicator eliminates the need for manual identification of fractals, saving you time and effort.
  • Clear Visualization: The indicator plots both resistance and support levels directly on your chart, providing a readily understandable view of potential price action.
  • Customizable: While the indicator uses default settings, you can adjust parameters to suit your trading style and risk tolerance.

How to Use the Indicator:

  1. Add the Indicator to Your Chart: Upload the Fractal Support and Resistance Indicator to your trading platform.
  2. Identify Support and Resistance Levels: Look for areas on the chart where the indicator plots horizontal lines. These represent potential support (lower line) and resistance (upper line) zones.
  3. Look for Price Action at the Levels: Observe how price interacts with the identified support and resistance levels.
  • Potential Long Entry: If price approaches a support level from below and shows signs of reversal (e.g., bullish candlestick patterns), a long entry opportunity may be present.
  • Potential Short Entry: If price approaches a resistance level from above and shows signs of reversal (e.g., bearish candlestick patterns), a short entry opportunity may be present.
  1. Confirm with Other Indicators: While the Fractal Support and Resistance Indicator provides valuable insights, it's recommended to combine it with other technical analysis tools (e.g., moving averages, RSI) for confirmation before entering a trade.
  2. Backtest Your Strategy: Thoroughly test your trading strategy using historical data to validate its effectiveness and refine your entry and exit criteria.

Disclaimer:

The Fractal Support and Resistance Indicator is intended for informational purposes only and should not be considered financial advice. Trading in the forex market involves inherent risks, and past performance does not guarantee future results. Always conduct your own research and exercise proper risk management before making any trading decisions.

The author doveforexmarkets has offered the item for free, you can now download it.

2 Downloads

Published:

22 Jan, 2025 10:09 PM

Version:

v1.0

Files Included:

Yes

Source Code Included:

Yes

Instructions Included:

Yes

Tags:

Doveforexmarkets's items

We use cookies to personalize your experience. By continuing to visit this website you agree to our use of cookies

More