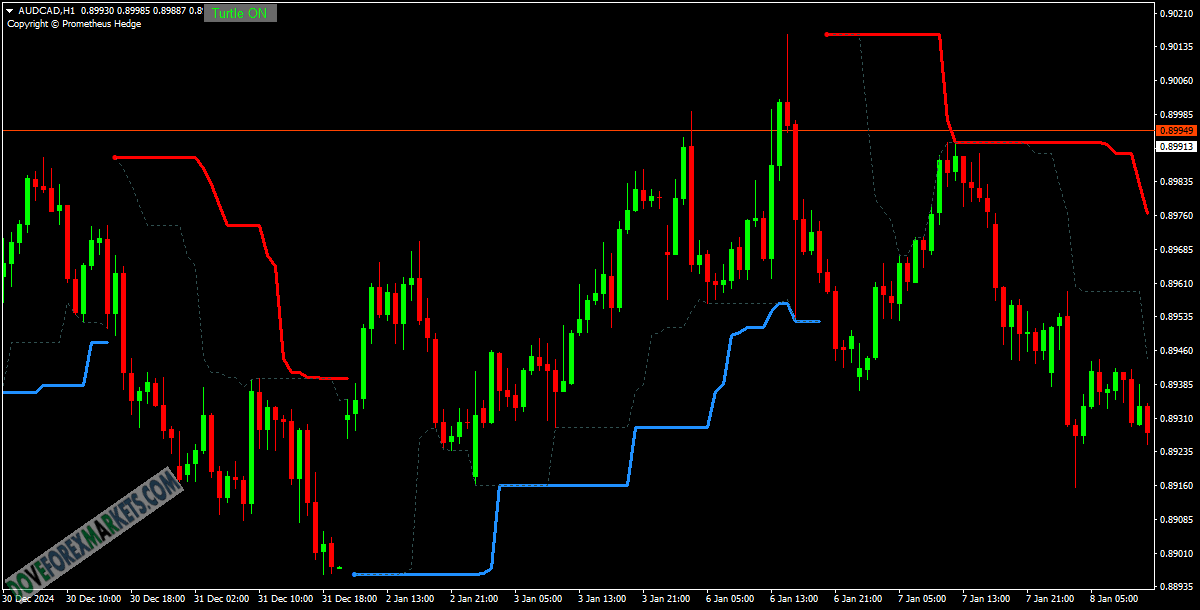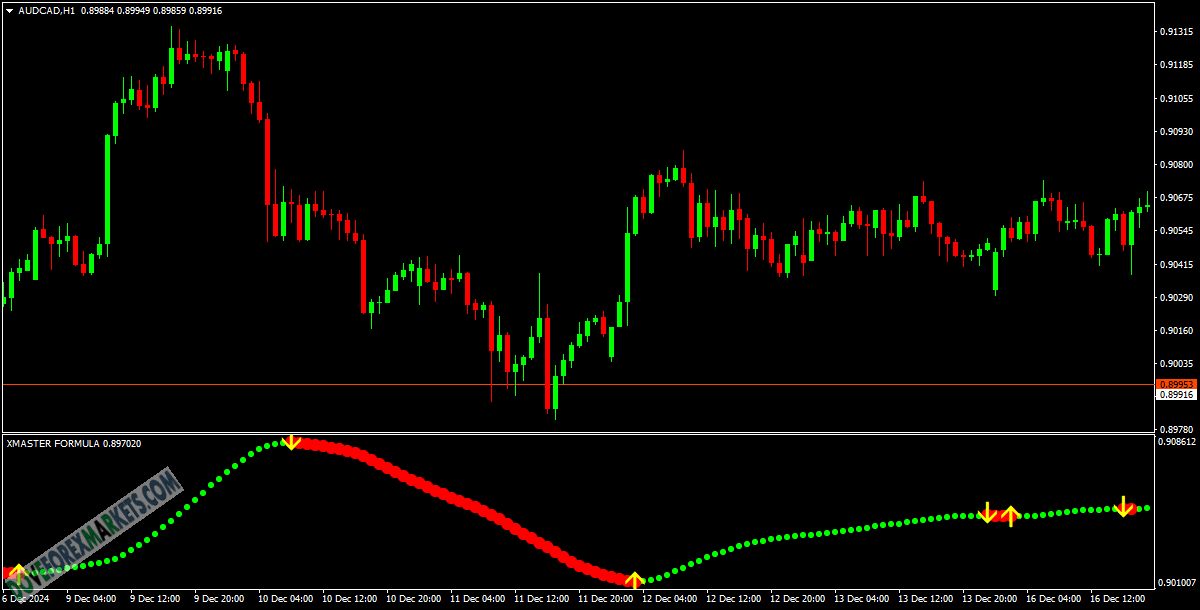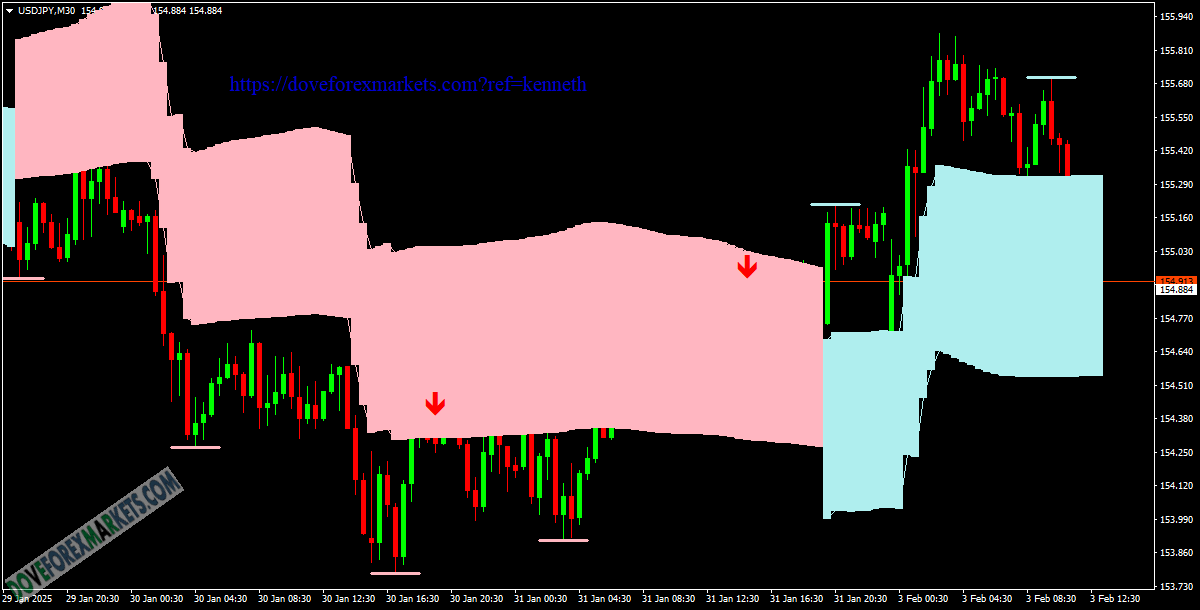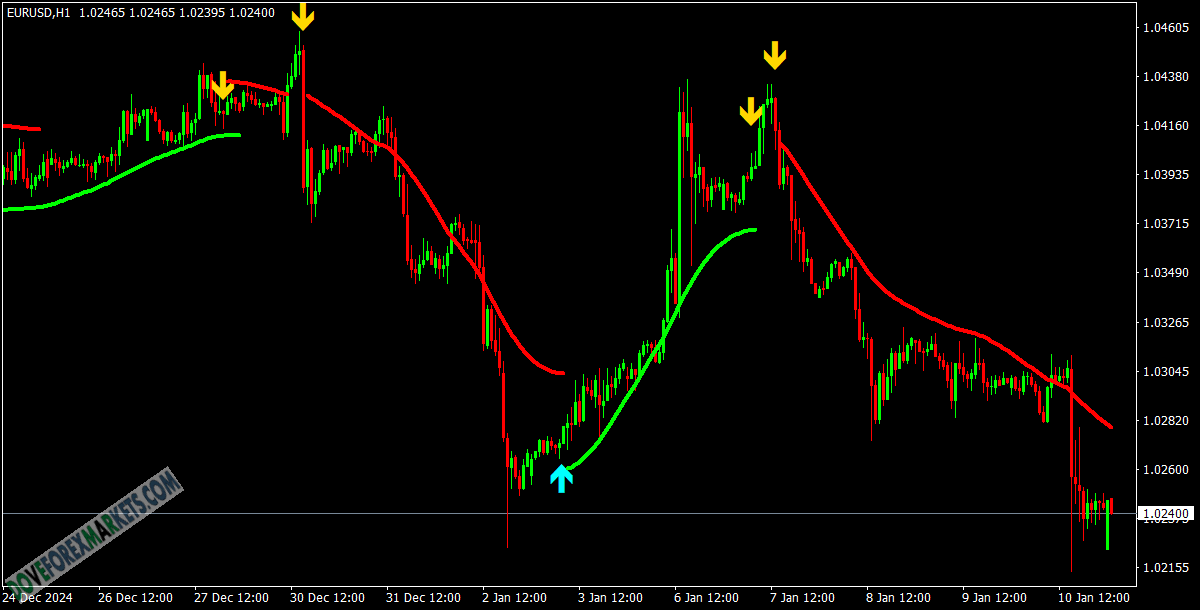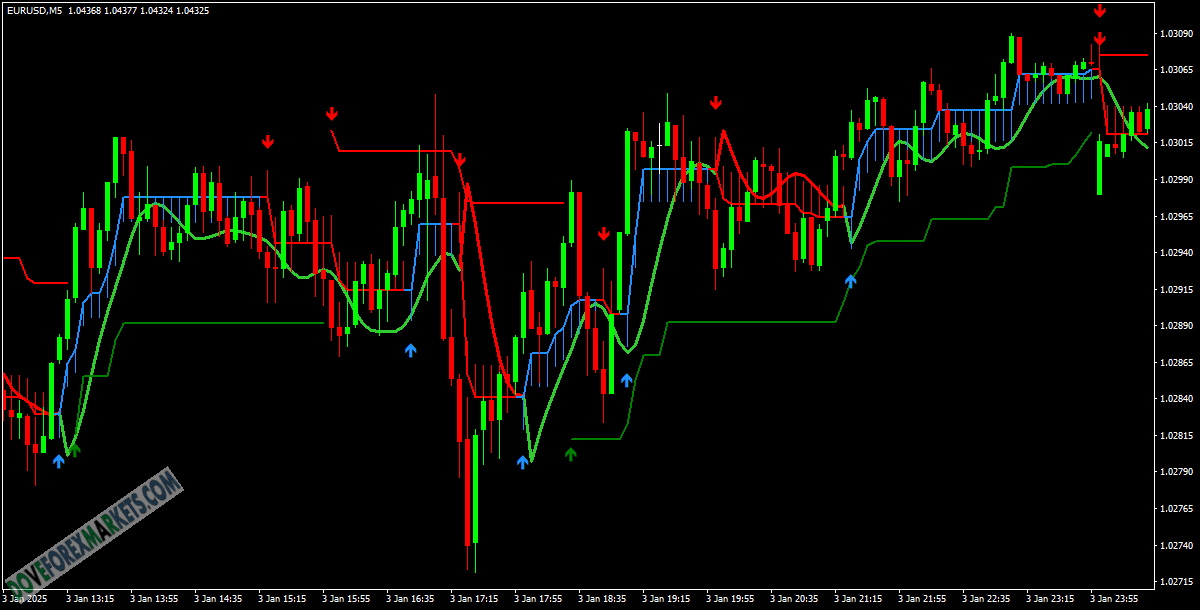
The Super Trend value is calculated based on its Nbr period and multipliers. We’ll determine the market trends depending on the price position compared to the indicator level.
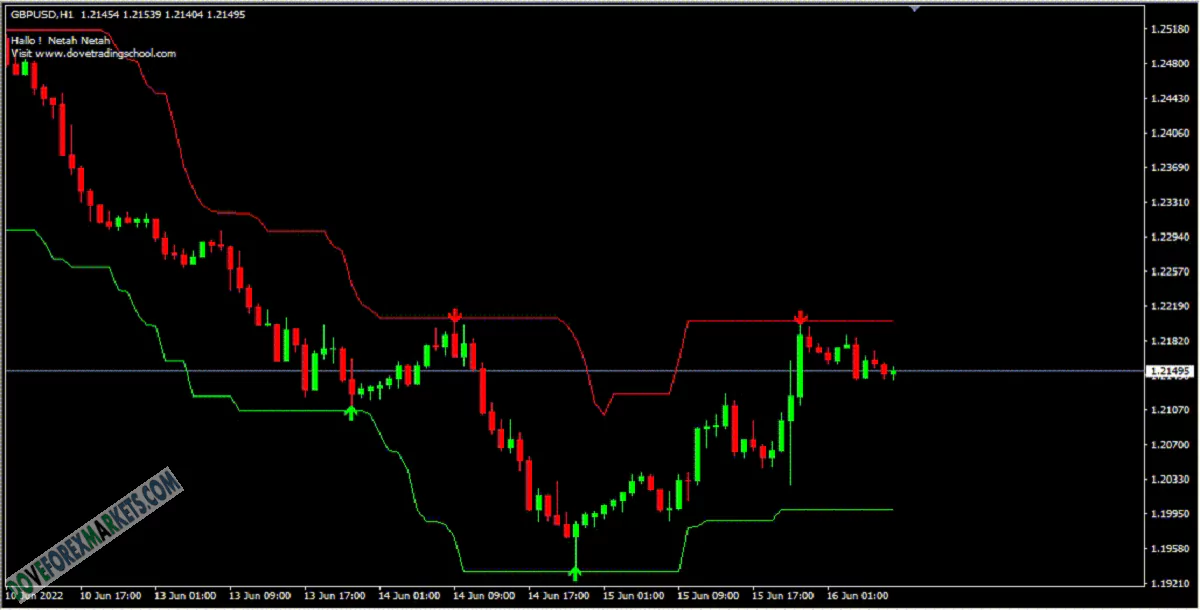
Generally, the price breaks the super trend line maintaining its position above the indicator level means the price is trending upwards. The indicator turns green during a bullish trend market. In such a condition, the indicator level will work as trendline support. Whenever the price breaks the support line, the indicator color turns red to signal a bearish trend. During a bearish move, the price treats the super trend level as a trendline resistance.
The author kenneth has offered the item for free, you can now download it.
Published:
20 Feb, 2025 09:38 AM
Version:
v1.0
Category:
Instructions Included:
YesSource Code Included:
NoFiles Included:
YesTags: